Household debt hit $19.1 trillion, and 5 percent of it is delinquent. But the rate at which borrowers newly fall behind actually eased. The scary number needs a second look.
5 min read
Americans owe $19.1 trillion. That is the headline from the New York Fed’s quarterly household debt report, released Tuesday: balances rose $334 billion in the third quarter, or 1.8 percent, with mortgages doing most of the work, up $257 billion to $13.4 trillion.
Read the fine print before the worry sets in. About half of that mortgage increase was not new borrowing at all. It was balances reappearing in the data after a reporting gap last quarter. The real increase was closer to half the headline.
The delinquency number is the one that will travel. Five percent of all household debt is in some stage of delinquency, up from 4.7 percent last quarter. About 13 percent of card balances are 90-plus days past due. Student loans are worse: 10.9 percent seriously late, up from 10.6 percent.
That sounds like households cracking. The Fed’s numbers say to slow down.
There are two ways to count delinquency, and they disagree. The stock is the pile of debt already late. The flow is the rate at which balances newly become seriously late. The pile makes headlines. The flow tells you whether the problem is getting worse.
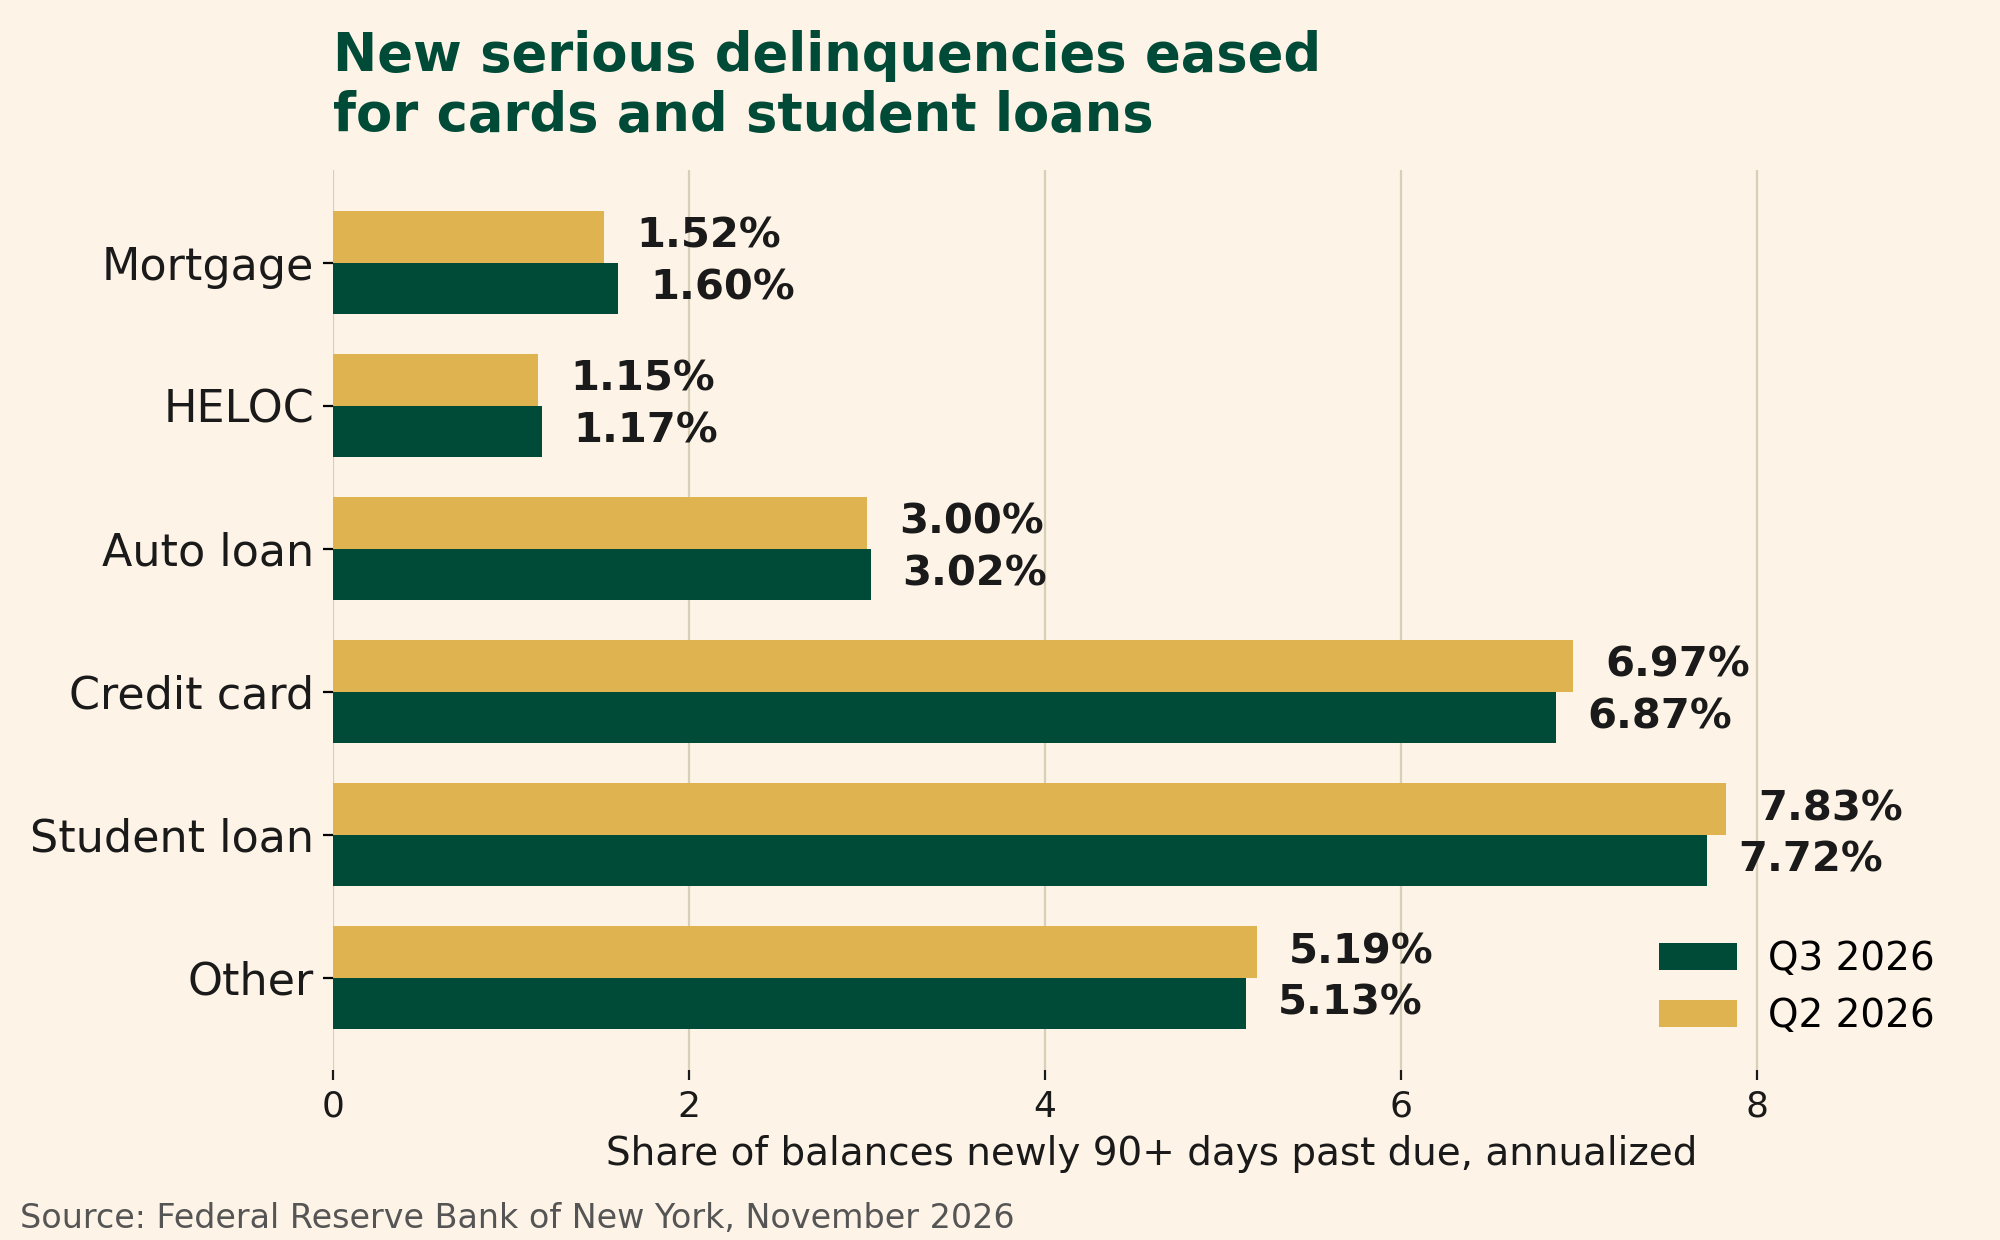
The flow is not getting worse. For credit cards, 6.87 percent of balances newly fell 90-plus days behind, down from 6.97 percent last quarter and 7.05 percent a year ago. Student loans improved too: 7.72 percent, down from 7.83 percent and from 14.26 percent a year earlier, when defaults resumed after the pandemic pause. Auto loans were flat at about 3 percent. Mortgages ticked up to 1.60 percent from 1.52 percent, but the Fed calls that low by historical standards.
So why does the pile keep growing if fewer people are newly falling behind? The Fed’s researchers answered that in August. The stock measure counts charged-off debts — balances lenders have already written off — for as long as they sit on credit reports. Lenders now keep those debts on the report far longer: 80 percent are still there a year later, up from about 40 percent a decade ago. The pile grows because old debts linger. Between late 2022 and early this year, the card stock measure rose from 7.6 percent to 12.8 percent while the flow stayed roughly flat.
Think of it as a bathtub. The flow is the tap. The stock is the water in the tub. The tap has not opened wider in two years. The water stays high because the drain runs slow.
The flow has limits too. It is annualized from a single quarter of data, so one bad quarter can move it. And it says nothing about whether delinquent borrowers catch up. A flat flow with a low cure rate still leaves a growing pile.
None of this is a clean bill of health. The counterweight is real. Student loans are the sore spot: 10.9 percent seriously late and still climbing, as borrowers who were current before the pandemic keep entering default. Early delinquencies — the first missed payments — ticked up for mortgages and auto loans. And the strain is not spread evenly. The Fed’s researchers found card delinquencies rose sharpest in lower-income neighborhoods, where pandemic-era cards went to borrowers with lower incomes and weaker credit scores — the accounts now showing distress.
Households are also leaning on their homes. Home equity lines of credit rose $23 billion in the quarter, the biggest increase since 2005 and the 18th straight quarterly rise. Borrowing is not collapsing. It is shifting toward the cheapest credit households can find.
What to watch next: the fourth-quarter report, due in February. Three numbers decide whether this quarter’s calm holds: the mortgage flow rate, the student loan 90-plus share, and the early delinquency rate on auto loans — the canary in past cycles.
Winners
- Cardholders who pay in full. Balances rose, but new serious delinquencies eased. The strain is concentrated, not universal.
- Homeowners with equity. HELOCs are the cheapest credit going, and households are reaching for them.
- Anyone who reads past the headline. The flow was the calm number in a loud report.
Losers
- Student loan borrowers. The one category where the pile keeps growing, at 10.9 percent seriously late.
- Lower-income cardholders. The distress is concentrated in their neighborhoods, on cards issued when standards were loose.
- The headline-only reader. The scary number is real, but it describes the past more than the future.
⚡ Spark Takeaway: A delinquency headline counts the pile. The flow counts the new cracks. When they disagree, follow the flow.
Sources: Federal Reserve Bank of New York, Quarterly Report on Household Debt and Credit, Q3 2026 (press release and report, November 10, 2026); Federal Reserve Bank of New York, Q2 2026 press release (August 11, 2026); Donghoon Lee et al., “How Distressed Are Consumers? Reconciling Diverging Credit Card Delinquency Measures,” Liberty Street Economics, August 11, 2026; Reuters, “NY Fed finds troubled debt levels ticked up in third quarter,” November 10, 2026.
LISTEN TO THIS STORY
Marcus Bell reads his story, 5 minutes 40 seconds.
Listen on Apple Podcasts · Listen on Spotify · Subscribe in another podcast app
KEEP READING
- The AI Bubble Watch — the standing scoreboard on the market’s biggest risk; household borrowing is the other side of the same consumer.
- The Market Watch — the follow-up list of companies the site’s own posts covered, each with one deciding number.
- What a Market Correction Is — the explainer: what the 10 percent label means, and what it doesn’t.
New posts by email
One short email when a new Financial Spark story publishes. No newsletter, no spam — unsubscribe anytime.